Gallery#
Welcome to the HoloViz.org Examples Gallery!
Discover a curated collection of domain-specific narrative examples using various HoloViz projects. Each example is thoughtfully crafted and fully documented, providing a comprehensive guide to explore and learn from. Whether you’re a newcomer or an experienced user, these examples are designed to inspire and educate.
For information on how to use these projects, see how to get started.
Contributions Welcome!
Choose Your Focus: Think about a topic, question, API, or visualization that excites you.
Draft Your Story: Outline the narrative you want to tell.
Learn and Create: Utilize existing examples and documentation to craft a Jupyter notebook that explores your chosen focus.
Contribute Your Work: Follow our contributing guide to submit your example.
Celebrate Your Contribution: Gain knowledge, share your insights, and help others in the community.
⭐ Featured#
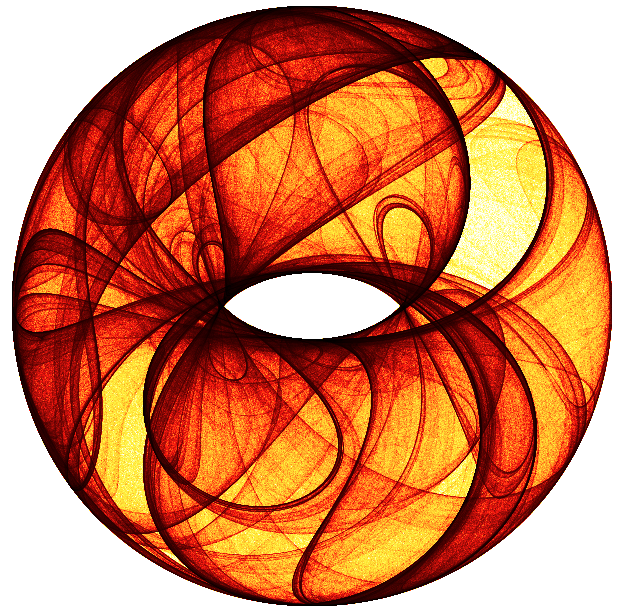
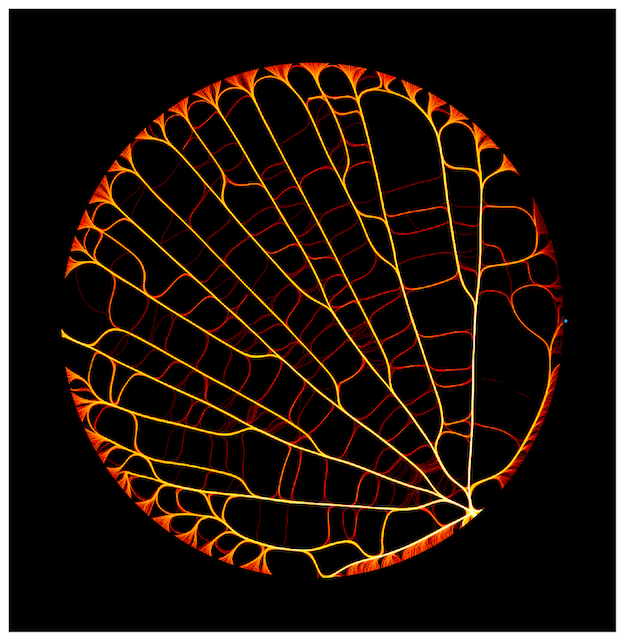
Calculate and plot two-dimensional attractors of a variety of types
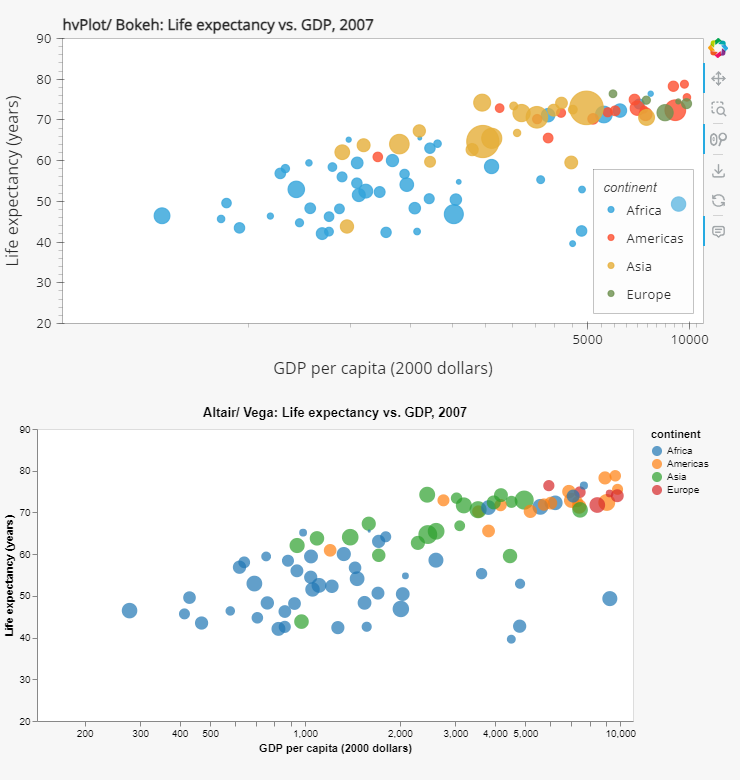
Using four different plotting libraries for the Hans Rosling gapminder example
Glaciers explorer using Datashader and Panel
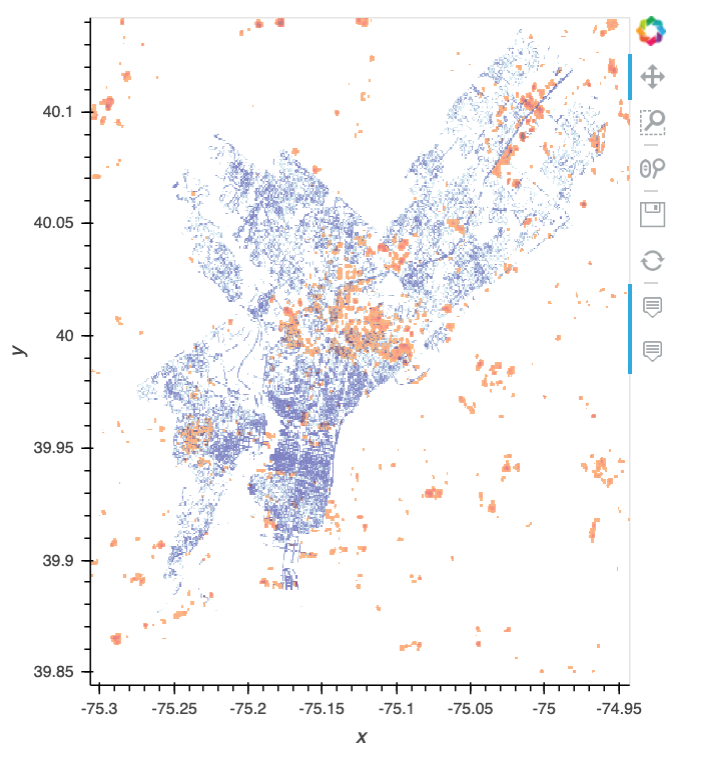
Analysis of how trees affect heat distribution in urban areas. Based on a blog post by Ken Steif.
Display and annotate multichannel timeseries data in Neuroscience
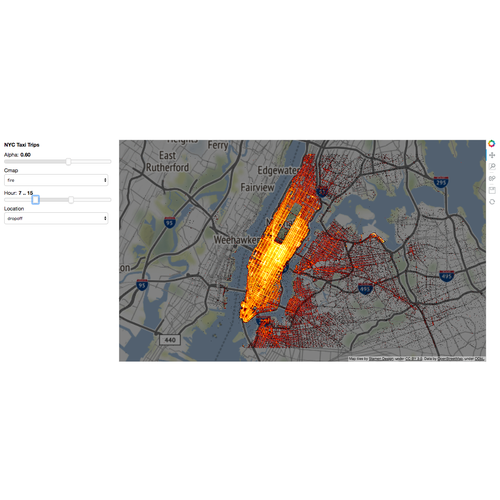
Plotting the NYC taxi dataset using Datashader.
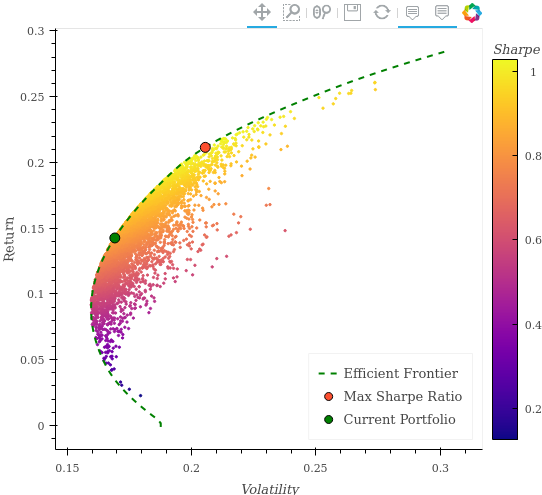
Portfolio Optimizer Application By Using The Efficient Frontier
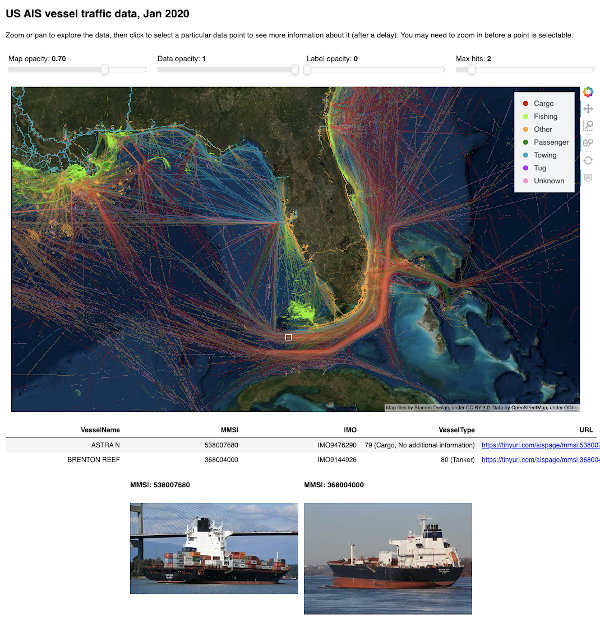
Visualizing AIS location tracking data for marine vessels near the USA
Geospatial#
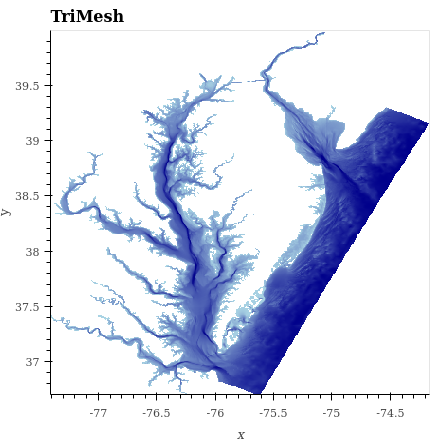
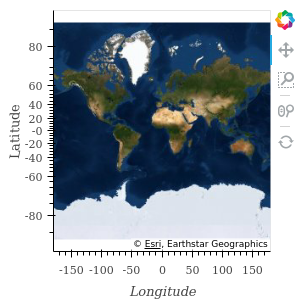
Visualizing water depth into the Chesapeake and Delaware Bays
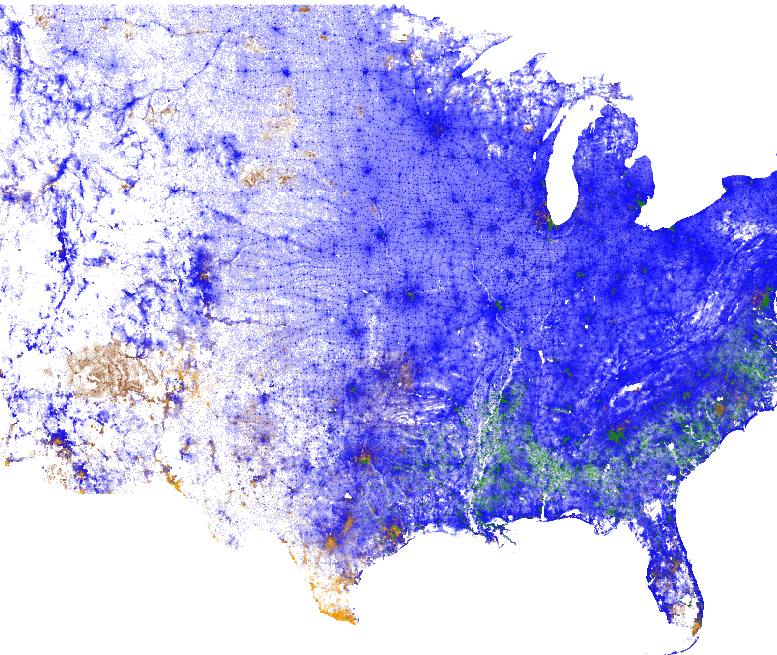
Visualize 2010 Census demographic data
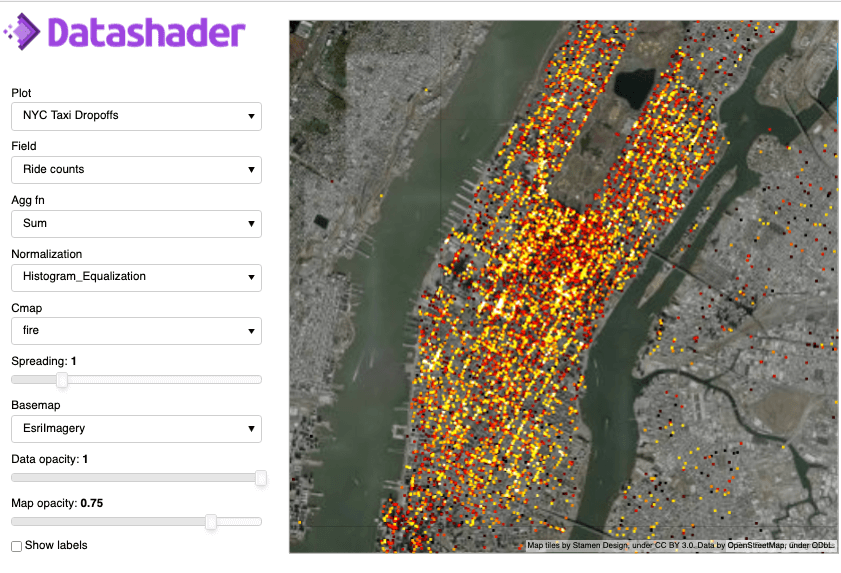
Interactive dashboard for making Datashader plots from any dataset that has latitude and longitude
Map of confirmed and candidate exoplanets by discovery date
Combine data of very different types to show gerrymandering
Glaciers explorer using Datashader and Panel
Visualizing GPS tracking for herring gulls in Belgium
Analysis of how trees affect heat distribution in urban areas. Based on a blog post by Ken Steif.
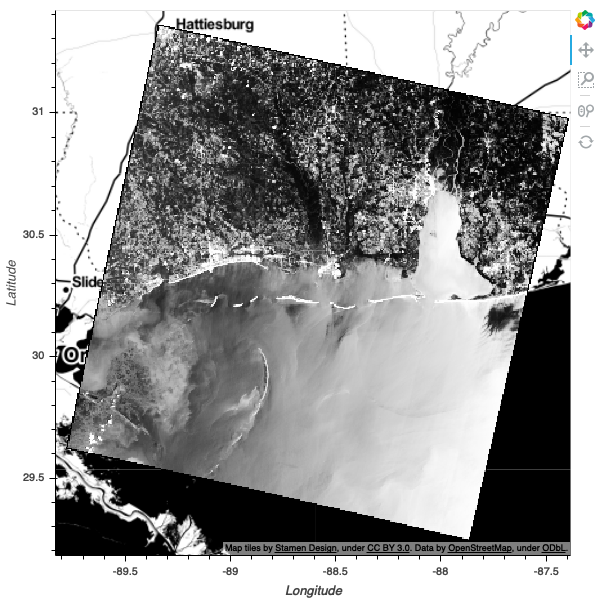
Datashading LandSat8 raster satellite imagery
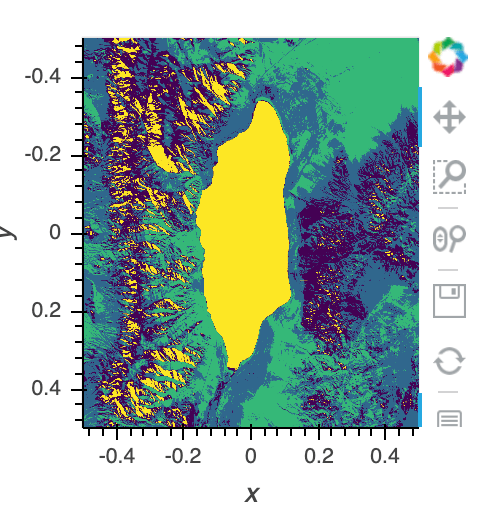
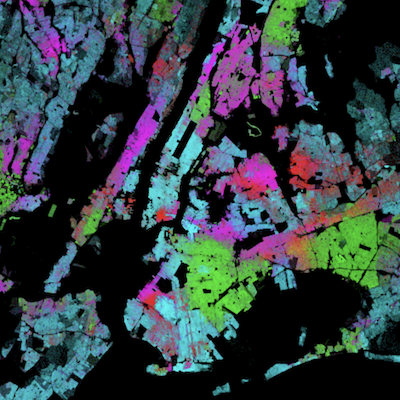
Example of spectral clustering landsat data
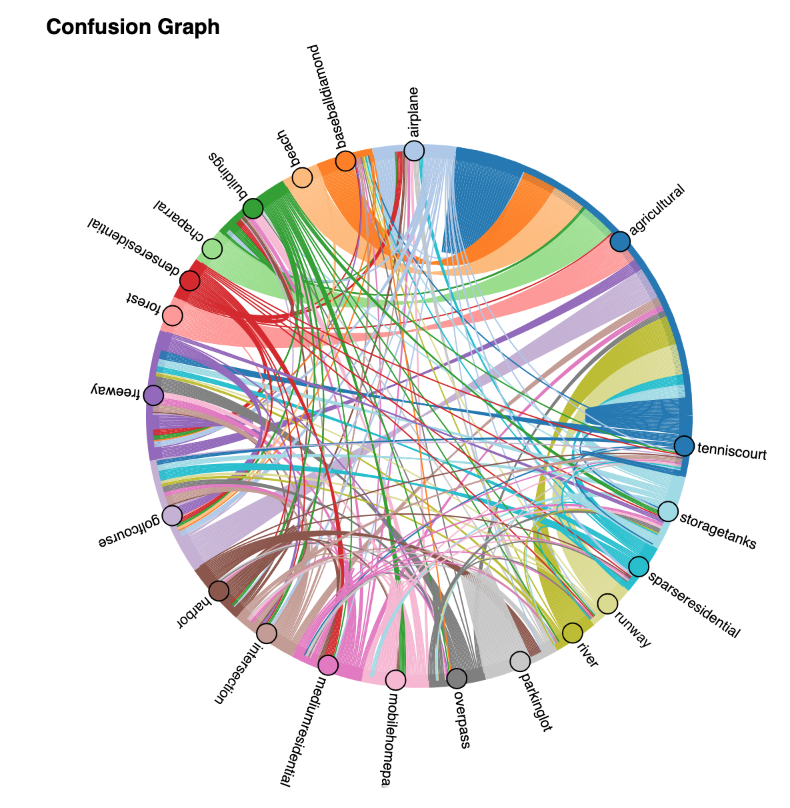
Image classification using the UC Merced Land Use Dataset
Using Bokeh/HoloViews/GeoViews for annotating data for ML
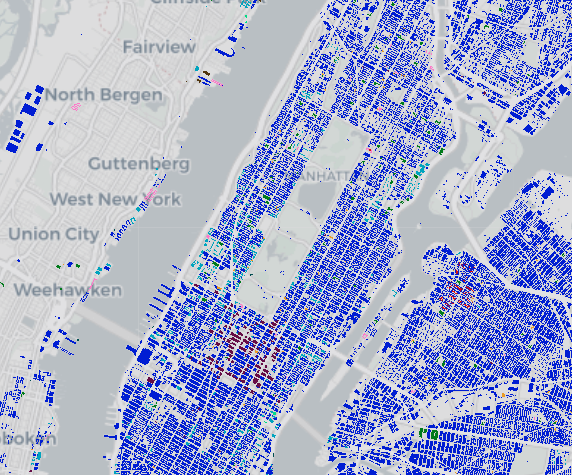
Visualize on a map all the buildings of New York City
Plotting the NYC taxi dataset using Datashader.
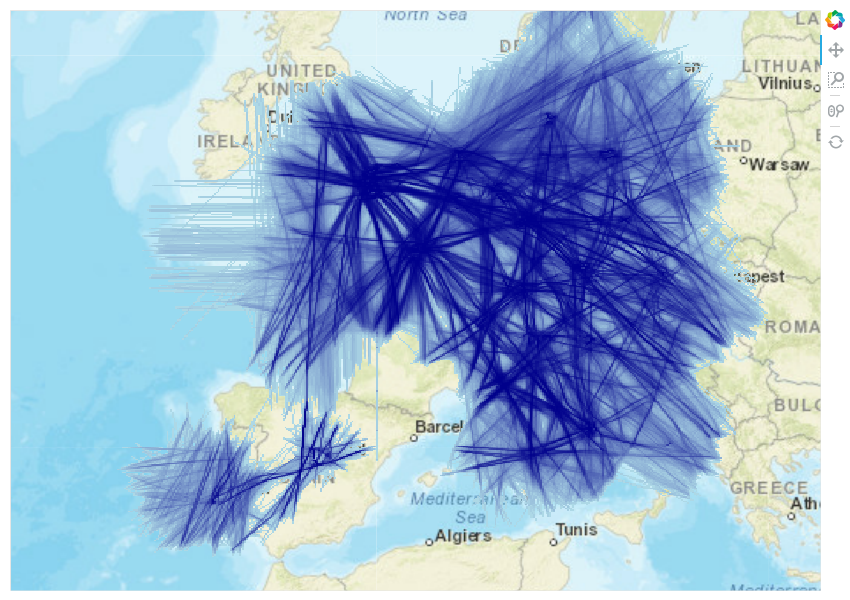
Datashading OpenSky flight trajectories

Datashading Open Street Map database
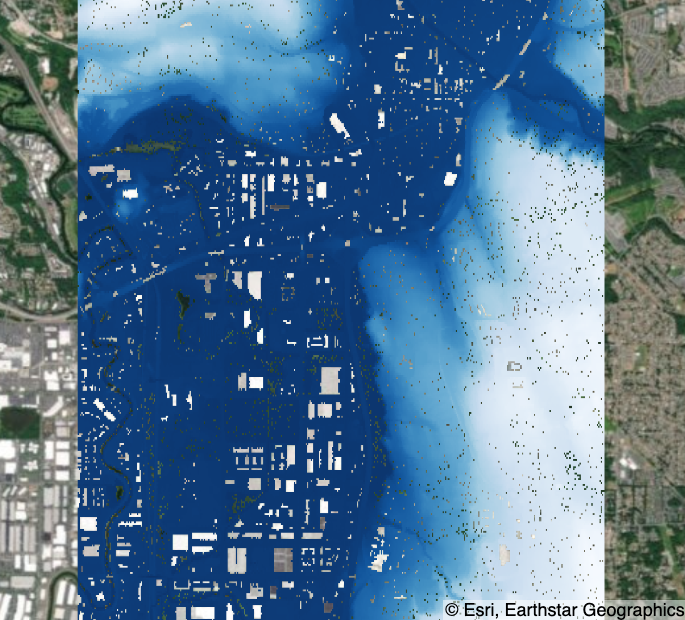
Visualize Lidar Scattered Point Elevation Data in Seattle
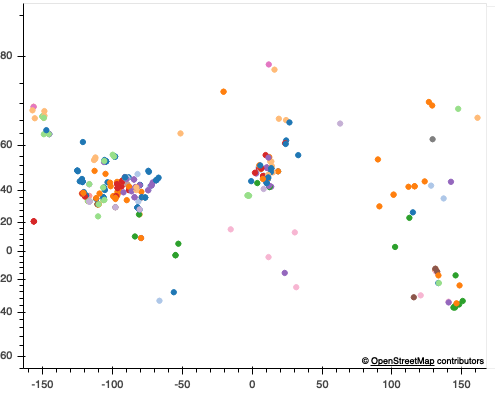
Visualizing AIS location tracking data for marine vessels near the USA
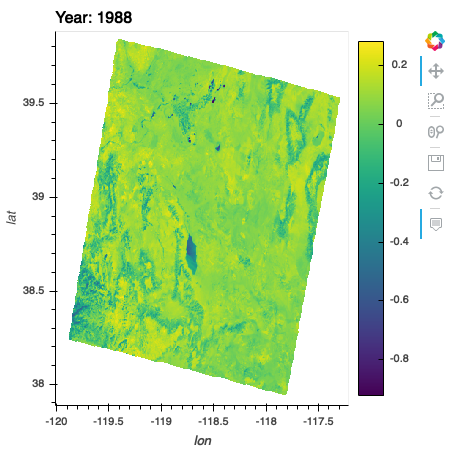
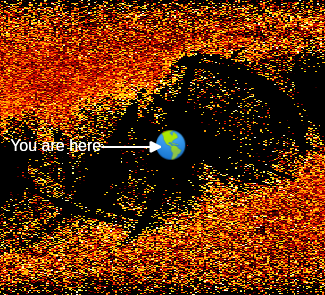
Analysis of NDVI over time of Walker Lake, Nevada
Finance and Economics#
Using four different plotting libraries for the Hans Rosling gapminder example
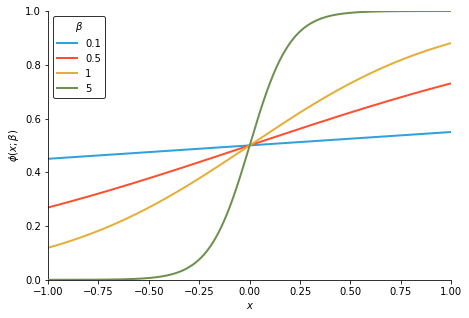
The Hipster Effect - An IPython Interactive Exploration. Adapted from the original notebook to use HoloViews by Philipp Rudiger.
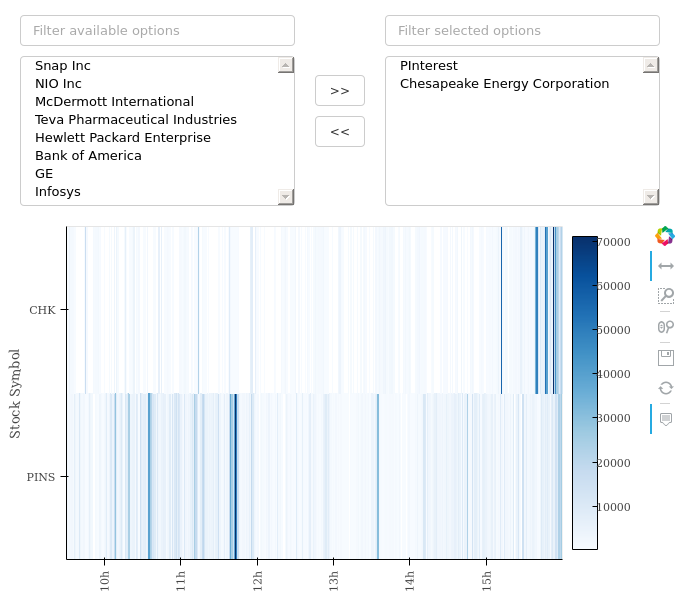
Dashboard visualizing stock trades on the IEX exchange
Portfolio Optimizer Application By Using The Efficient Frontier
Mathematics#
Calculate and plot two-dimensional attractors of a variety of types
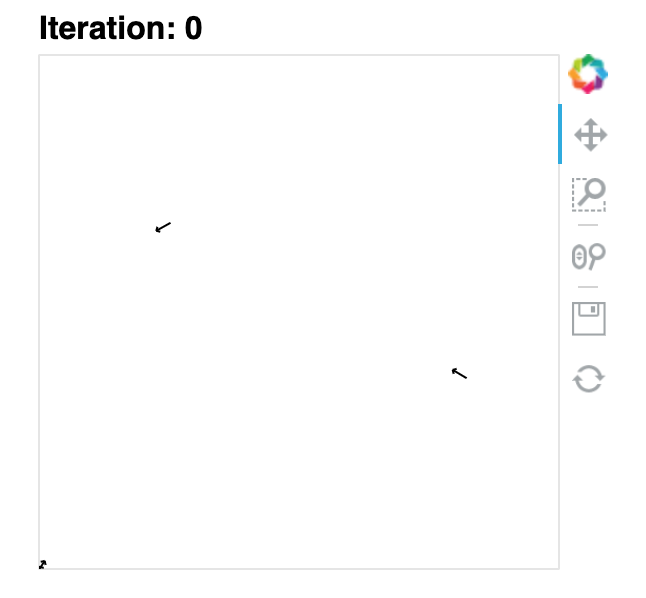
Boids models of swarm intelligence using HoloViews

Panel dashboard illustrating Euler’s Method

Interactive dashboard for Genetic Algorithm
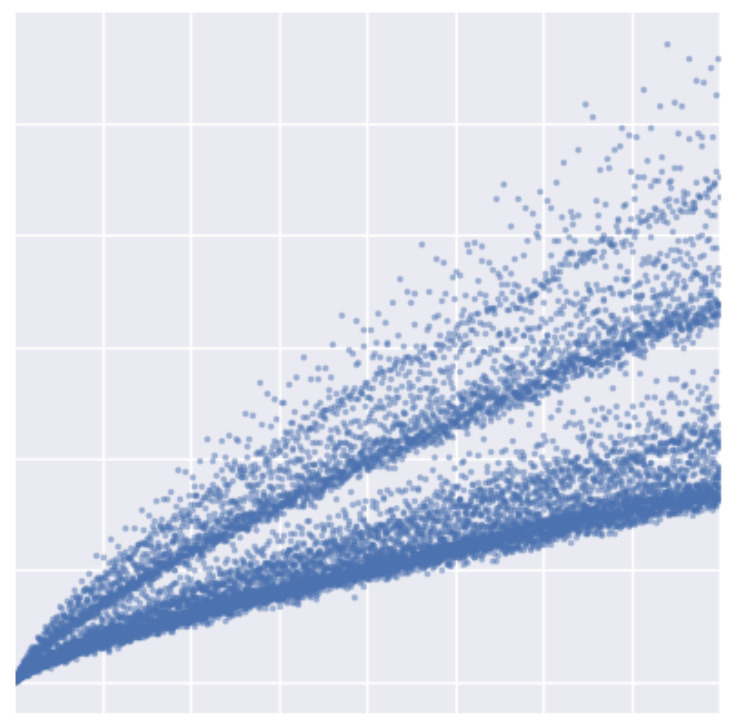
Evaluating Goldbach function with Numba and plotting it with Datashader
The Hipster Effect - An IPython Interactive Exploration. Adapted from the original notebook to use HoloViews by Philipp Rudiger.
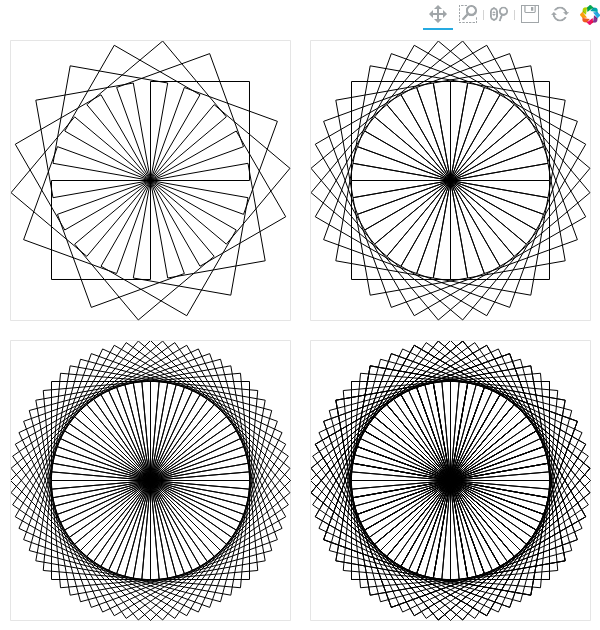
Lindenmayer system - a mathematical system used to describe growth processes
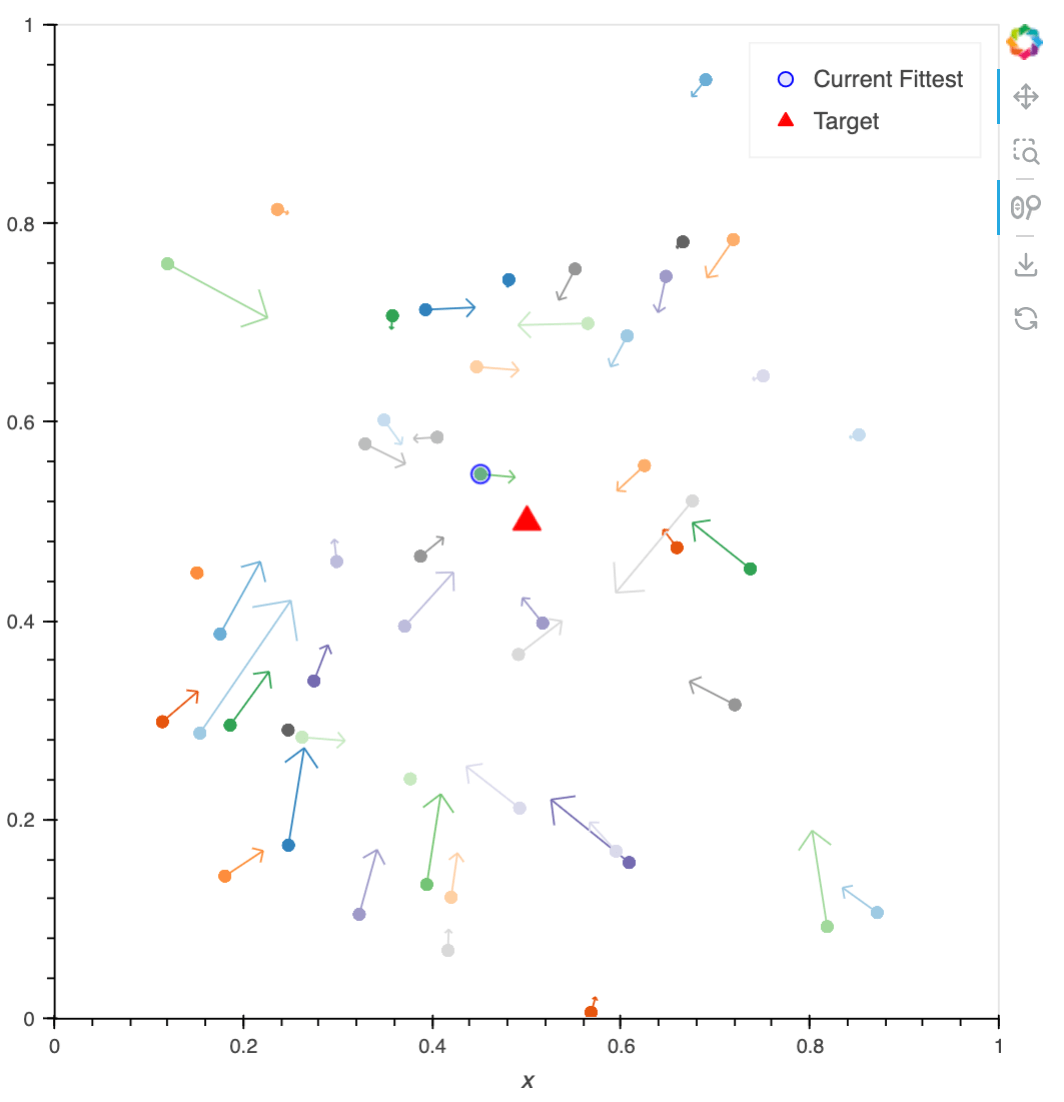
Interactive dashboard for Particle Swarm Optimisation
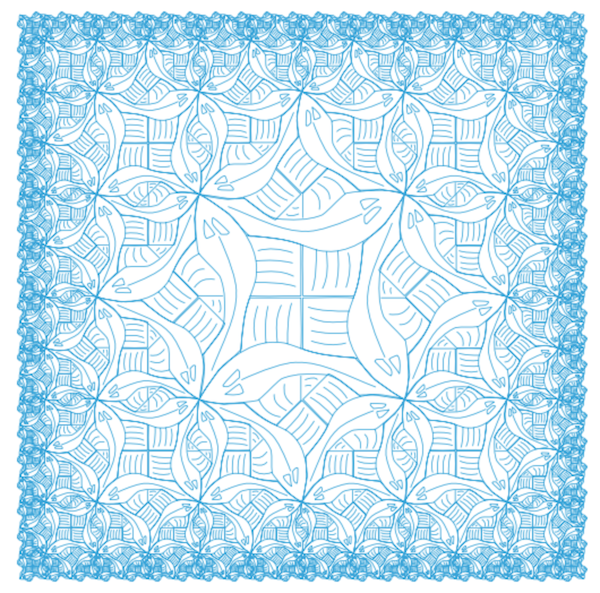
Recreating the Square Limit woodcut by M.C. Escher using Holoviews Spline
Neuroscience#
Display and annotate multichannel timeseries data in Neuroscience
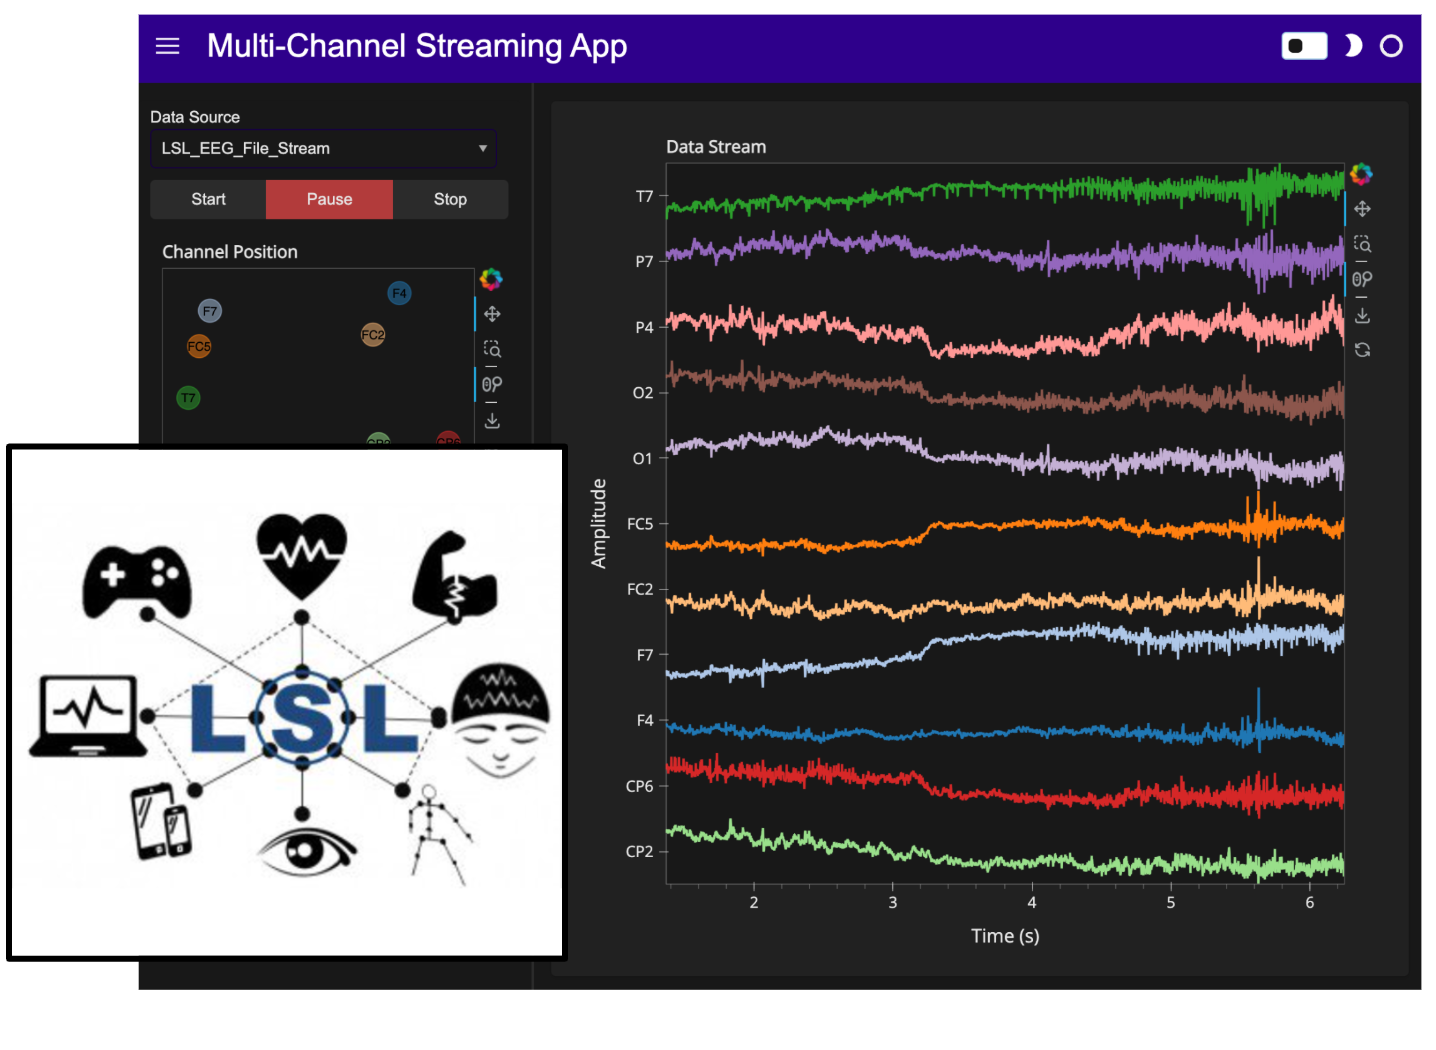
Streaming display of multichannel timeseries data.
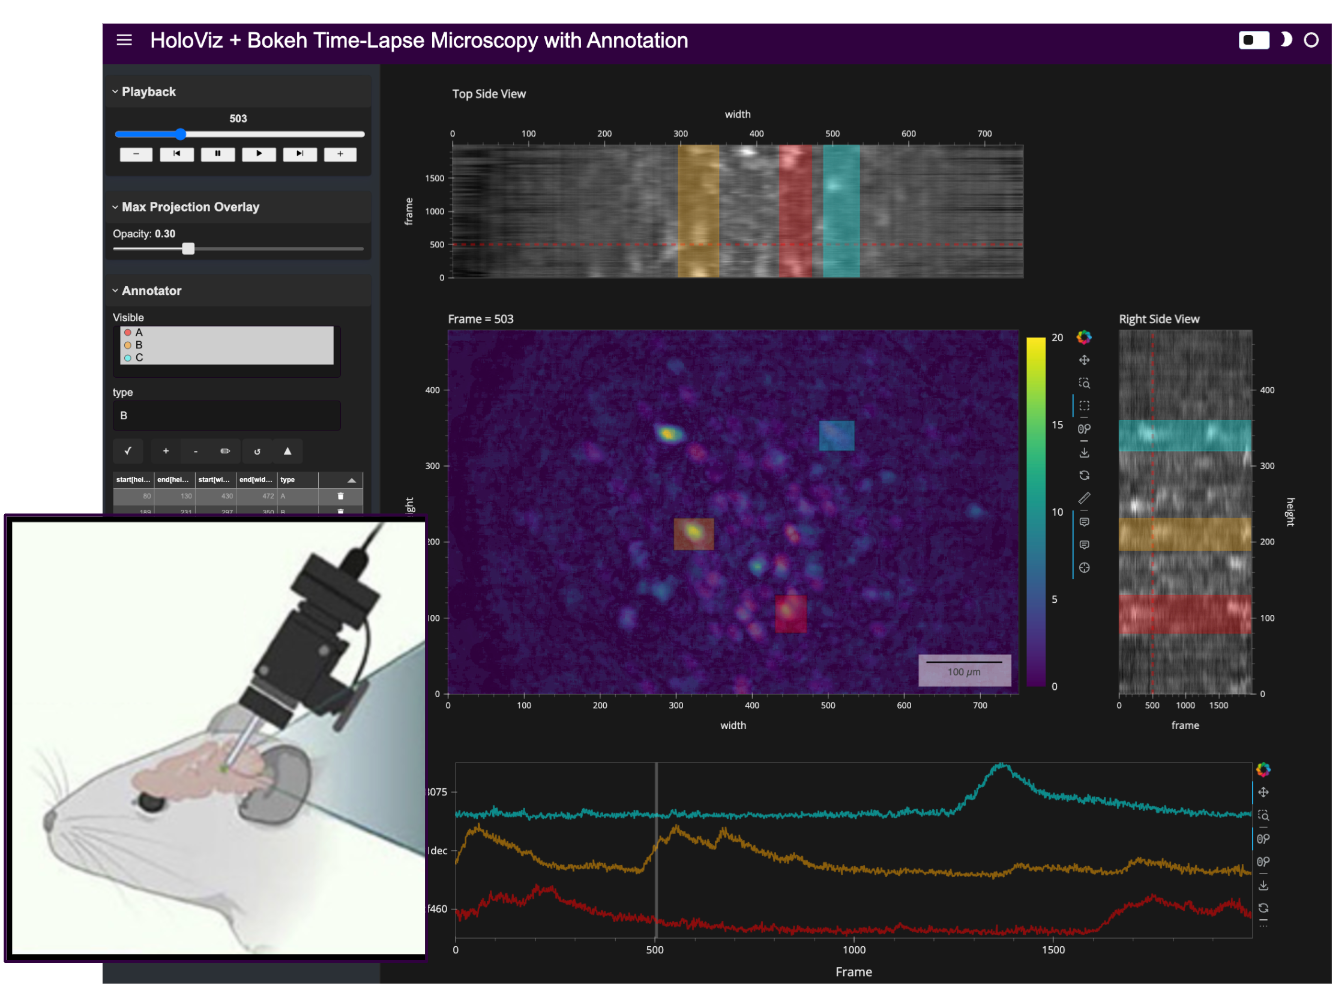
Display and annotate time-lapse microscopy in Neuroscience
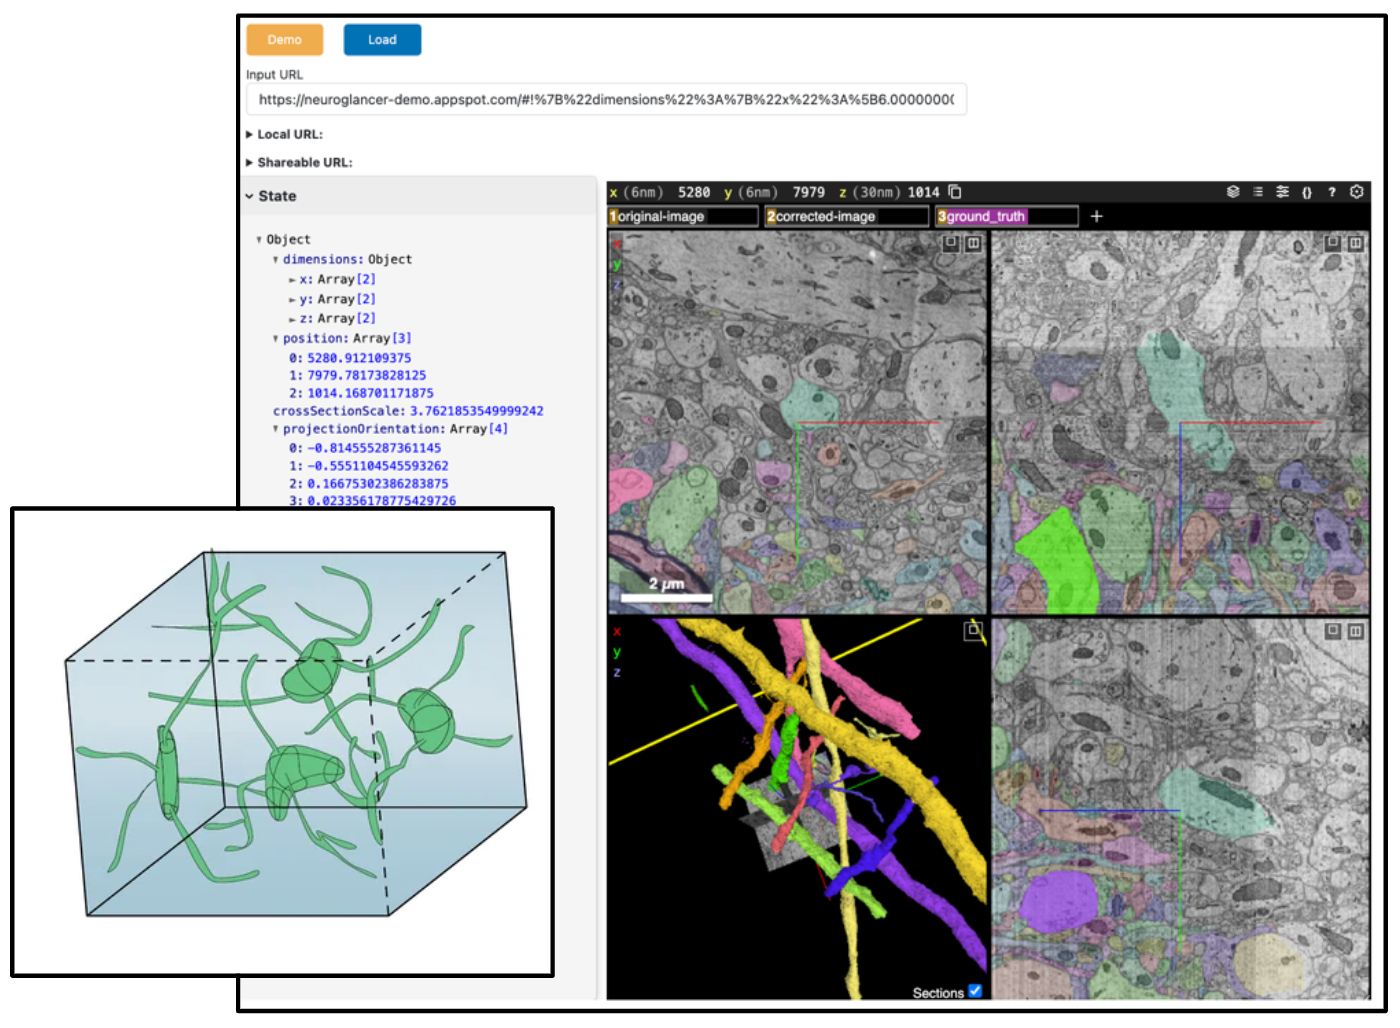
Display 3D image and segmentation data in a Jupyter notebook.
Cybersecurity and Networks#
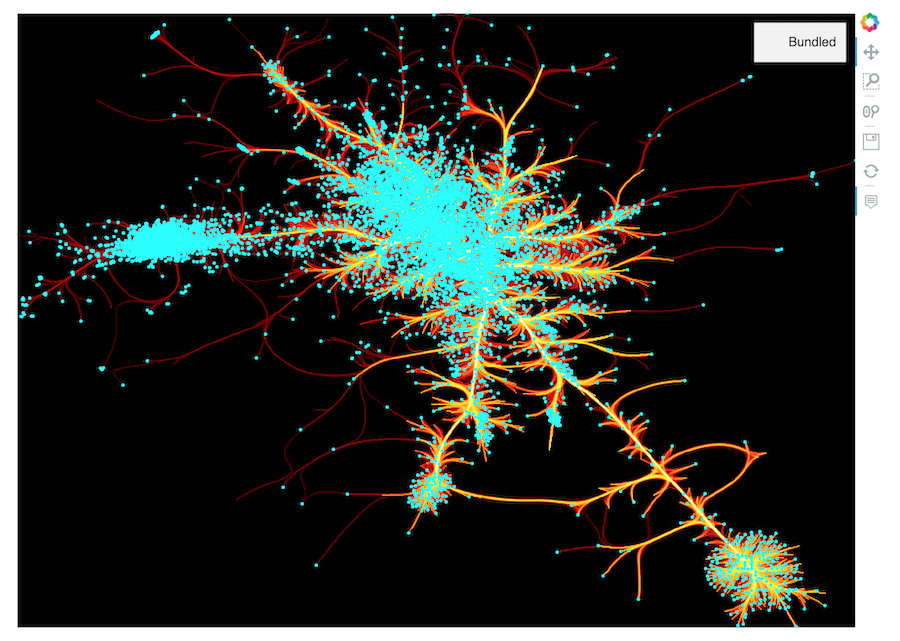
Graphing network packets using networkx, holoviews, and datashader
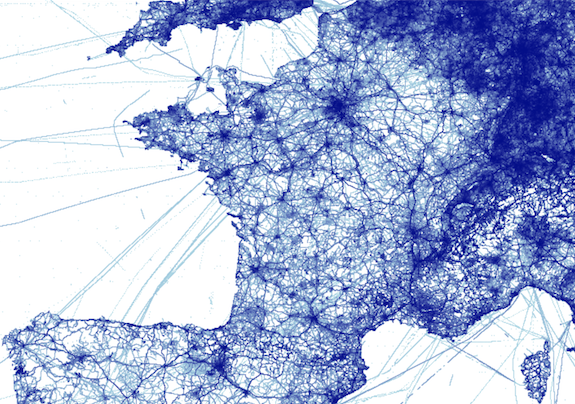
UK research networks with HoloViews, Bokeh, and Datashader
Other Sciences#
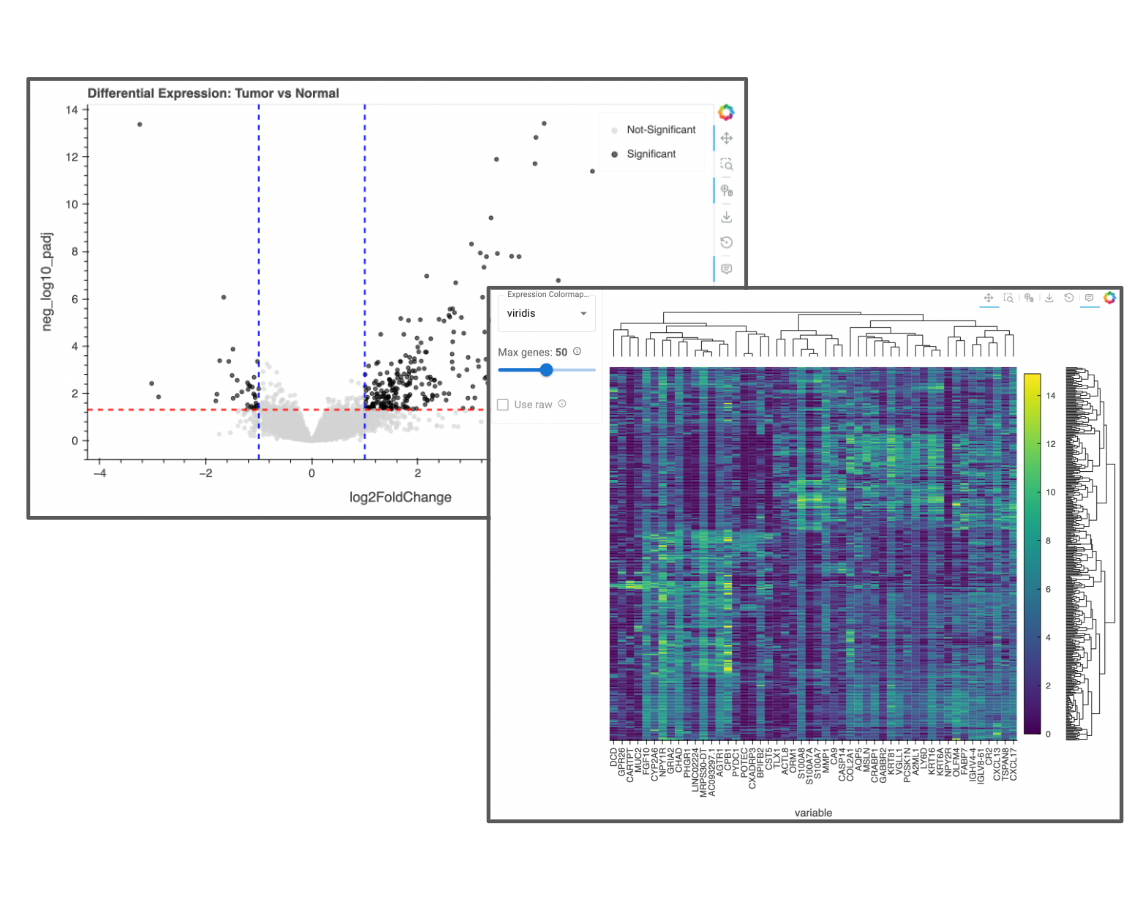
Conduct differential gene expression analysis on bulk RNA-seq (TCGA) data using AnnData and DESeq2
Boids models of swarm intelligence using HoloViews
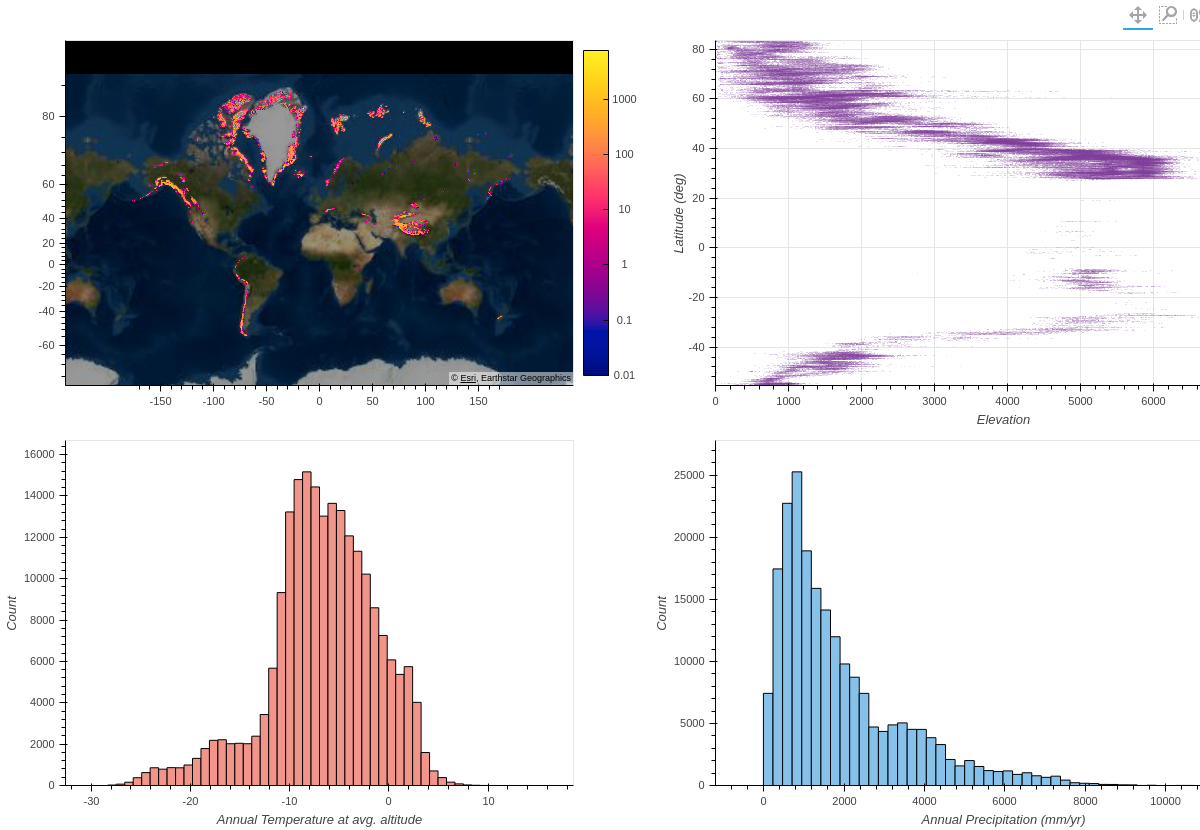
Analysis of NASA Goddard/University of Alabama carbon monitoring project NEE Data Fusion
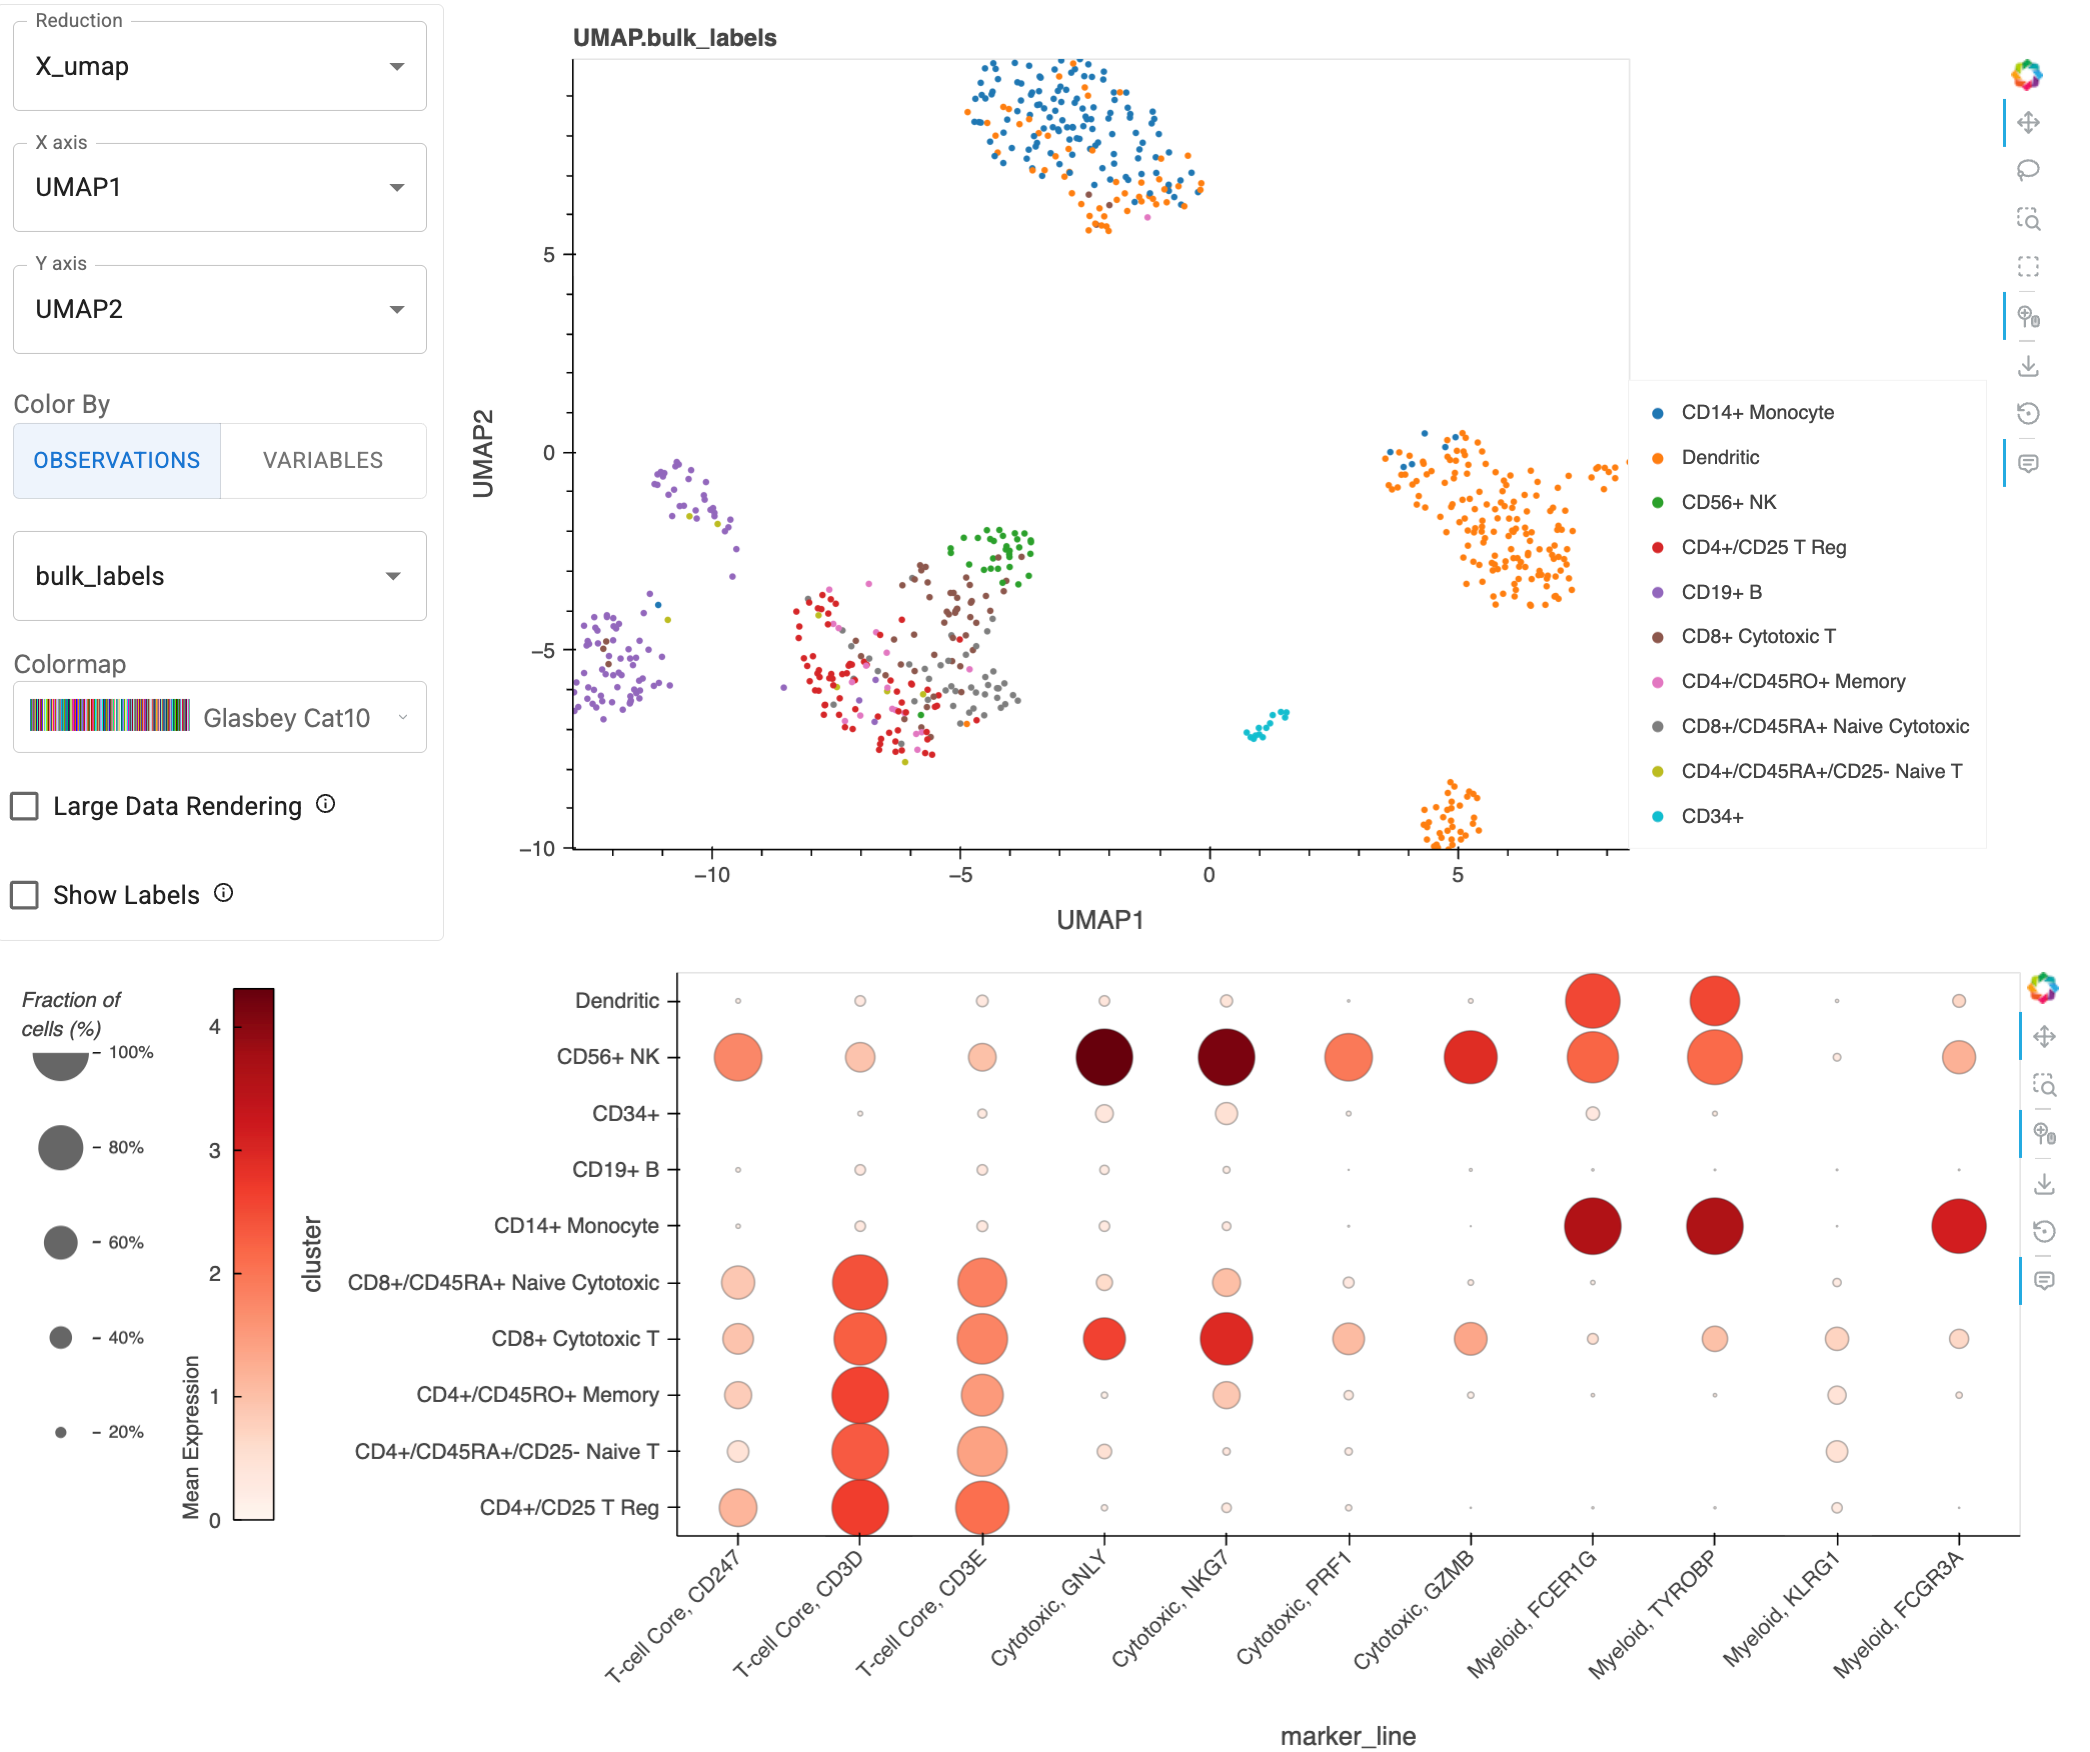
Explore single-cell populations by linking cluster visualization with marker gene expression analysis
Interactive dashboard for Genetic Algorithm
Visualizing GPS tracking for herring gulls in Belgium
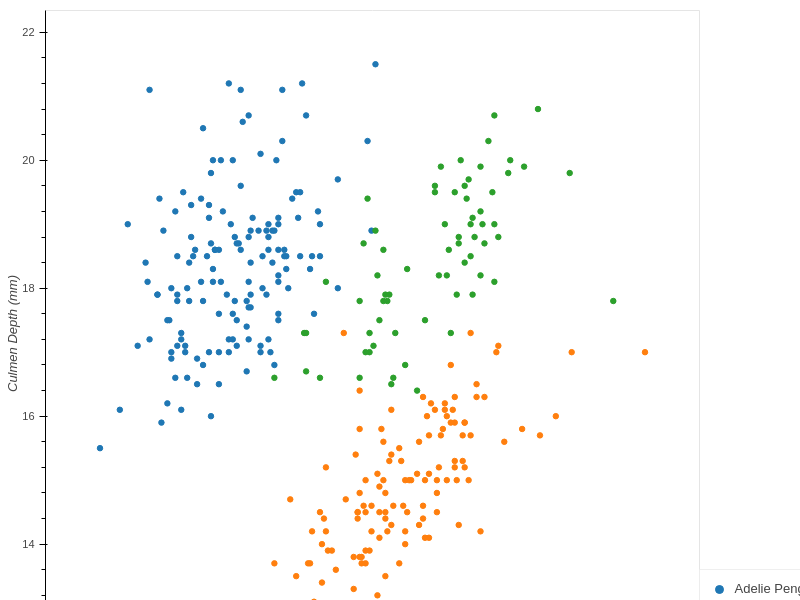
Palmer Penguin Cross-Filtering
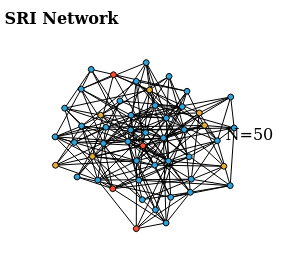
Agent based modelling in epidemiology using HoloViews
Sports#
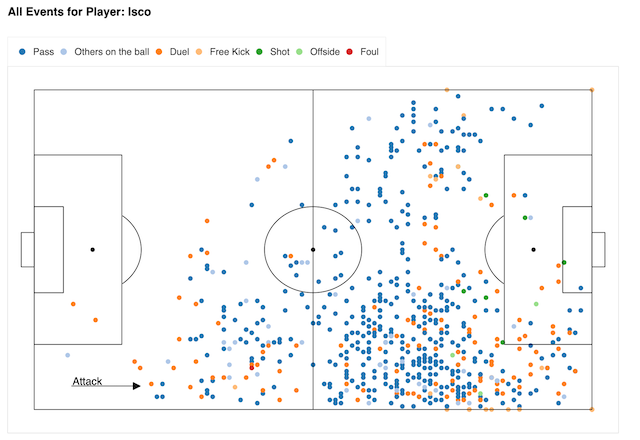
Analysis of key events in the 2018 FIFA World Cup